BI & Analytics, so dashboards drive real decisions.
There's no single BI tool that fits every kind of reporting. Power BI, Highcharts and Databricks AI/BI each earn their place for a different reason — and we pick whichever one actually gets the right data in front of the right person, in a shape they'll use.


The BI platforms and dashboards behind our reporting work.
Power BI
Microsoft's enterprise BI platform — the natural choice when reporting needs to sit close to Microsoft 365, Azure and the data teams already using both.
Learn more 02Highcharts
A JavaScript charting library for dashboards embedded directly inside a product, not a separate reporting tool bolted on the side.
Learn more 03Databricks AI/BI
Where reporting and machine learning share a platform — dashboards that don't just describe what happened, but can predict what's next.
Learn moreSame senior team, whichever BI tool fits.
BI & Analytics work isn't one thing, and treating it like one is how projects end up with a dashboard nobody uses. The right tool depends on who's reading the report, how often, and whether it needs to live inside a product or stand alone.
What doesn't change is who's building it. Every one of these platforms is used in-house by the same senior engineering team — a report is only ever as good as the data pipeline underneath it, and we build both.
The right tool, not the familiar one
An embedded product dashboard and a monthly board report are different problems — we pick Highcharts, Power BI or Databricks AI/BI accordingly, not out of habit.
A real pipeline underneath, not just a pretty chart
A dashboard is only as trustworthy as the data feeding it, so we build the pipeline and the report as one piece of work, not two.
Built for the person reading it
An executive scanning a KPI once a week needs something different to an analyst querying live data — we design for the actual reader, not a generic dashboard.
From descriptive to predictive
Databricks AI/BI means a report doesn't have to stop at what happened — it can also forecast what's likely to happen next.
Not sure which BI tool fits? Ask the engineer who'd build it.
Book a 30-minute working session with a senior engineer — a real conversation about your reporting, not a sales call.
More on BI & Analytics.
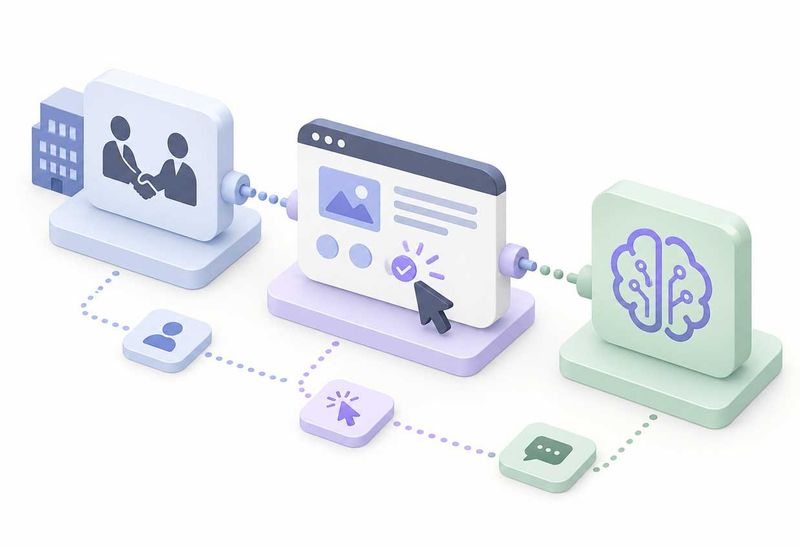
B2B White-papers Interactive Content & NLP
Week 5 of the High Digital AI Initiatives Series. Today, we are radically redesigning how B2B buyers interact with thought leadership content.
Read more
Fore-Site: Computer Vision for Field Operations
Week 4 of the High Digital AI Initiatives Series. This week, we’re moving from the database to the field, exploring applied computer vision
Read more
Hanse: Enterprise LLMs & Data Querying
Week 3 of the High Digital AI Initiatives. Today, we look at how Generative AI is replacing complex SQL queries in the trade data and supply chain analytics sector.
Read moreThe stack we ship on.
Pragmatic, mostly boring, and chosen because it works in production — not because it's on the front page of Hacker News.
Have an outcome in mind?
We'll help you
ship it.
- You're building a data product and need a team that can deliver.
- You want to get AI-ready — pragmatically, not theoretically.
- Your reporting is a mess and you need a real platform underneath it.